
 The Sakata five are composed of five pattern groups which all use the number three …
Three Gaps Pattern (Sanau)
This pattern appears when the trading is moving higher or lower. When the market is moving higher, a gap happens when the opening price moves above the prior sessions close, and creates an empty spot on the chart. The three gaps pattern means that the trend has reached the exhaustion phase and is about either consolidate or pivot. After the third gap of this pattern appears the market trend should reverse.This pattern appears when the trading is moving higher or lower. When the market is moving higher, a gap happens when the opening price moves above the prior sessions close, and creates an empty spot on the chart. The three gaps pattern means that the trend has reached the exhaustion phase and is about either consolidate or pivot. After the third gap of this pattern appears the market trend should reverse.
Three Parallel Lines (Sanpei)

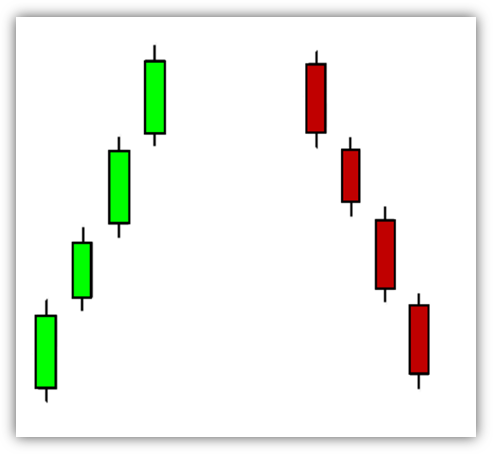
Figure 3 - Three Red Crows & Three White Soldiers
The opposite of three gaps, the three parallel lines because they signal a continuation of trend. They are composed of three red or green candles that do not gap away from each other. The pattern refers to three consecutive candlesticks that are going in the same direction, with each candle opening in the range of the prior real body. This can indicate that the current trend direction is expected to continue and traders should plan accordingly. When the three candlesticks are bullish, the formation is known as the three soldiers; when bearish, the pattern is called the three crows.
Parallel patterns are more common than three-gap patterns. Although traditionally these patterns are interpreted as continuation patterns, if found early in a trend move, they show strong momentum for the trend. In addition, these patterns may indicate a weakening market trend
Three Rivers (Sansen)
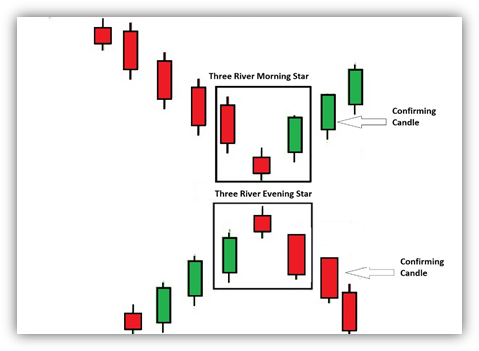
Figure 7 Three River Stars
Perhaps the pattern group that Western candlestick technicians write about the most is the three-river group, composed of the three-river morning and evening stars, the southern cross and the "three-river bottom." "Three rivers" refers to a battle in Japanese history that was fought over a province with three rivers. The eventual victor won by conquering all sides of the river banks, thus controlling the rivers. The three-river pattern group are all reversal patterns. This pattern looks different depending on if the reversal is bullish or bearish.

Figure 8 Three River Evening Star

Figure 9 Three River Evening Doji star
The bearish version of this pattern is called a three-river evening star. It needs to contain the following; first and foremost, this pattern must occur after a defined uptrend. The pattern consists of three candles, and a final confirming candle. The first candle will be a long bullish green candle that makes a lower low than the prior candle. This candle is followed by a small bodied candle, either a spinning top or a doji. If it is a spinning top color is not important
This second candle must gap above the close of prior green candlestick which labels it a star in the evening position. The third candle must be a bearish long red candle which opens below the real body of the star above it. It is best to wait for a confirming candle (occurring after the three-candle pattern) which will be a long red candle with a lower low, and a lower high than the previous red candle.

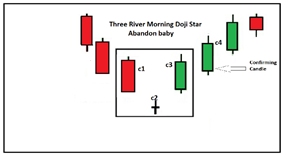
The bullish version, is called a three-river morning star, first this pattern must occur after a defined downtrend. The first candle be a long bearish red candle making a lower low than the previous candle. The second candle will be composed of a spinning top or doji that gaps below the close of the prior red candle. If it is a spinning top color is not important. The third candle must be a long green bullish candle which opens above the real body star below it. Just as in the bearish version a confirming candle is important. In the case of the bullish pattern the fourth candle will be a large bullish green candle with a higher high, and higher low, than the previous bullish candle.
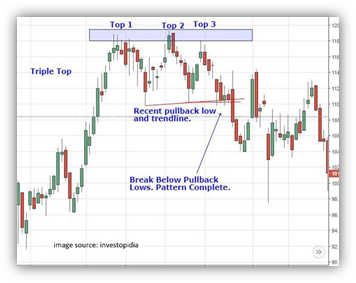
Three Mountains (Sanzan)
This pattern contains many candles and is analogous to the Western pattern called a head and shoulders formation. The name refers to the belief that prices rise and fall in a series of three steps or levels. This pattern has been used in both Japanese Candlesticks Analysis, as well as in the Western techniques, the triple top pattern in Japanese candlesticks is called Three Mountains. This model plays an important role as a reversal sign. Three Mountains pattern forms when the price rebounds three times from resistant level. It is also called a Three Buddha pattern. The name comes from a tradition of placing two small Buddha figures on the sides of the big one. This formation has been identified by both Eastern and Western technical analysts. However, the Japanese version, (Three Buddha or three Mountains), were identified almost a hundred years earlier its Western counterpart the Head and Shoulders pattern.
That being said the fact that It is noteworthy is both the Eastern technician and Western technician were both able to recognize is pattern is a supremely strong reversal pattern.
Three Method (Sanpo)
Image source: Copyright © 1997- 2005 Straits Index (M) Sdn Bhd. All rights reserved.
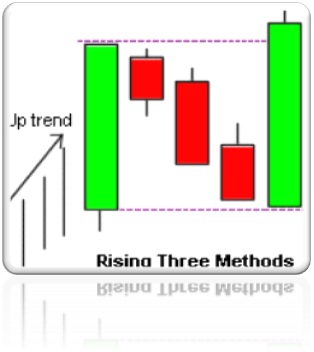

The Sanpo indicates that is a short-term consolidation with a direction opposite that of the prevailing trend. There are two types of Sanpo: Rising Sanpo (bullish) and Falling Sanpo (bearish). Sanpo occurs when there is no market goes straight up or down. At this point, traders must occasionally pause when following a trend.
This method refers to a trading philosophy that dictates when to be in and out of the market. The three states of activity of trading—the three methods—are buying, selling or resting. In essence, this method refers to differing trading theories. Sokyu Honma tried to achieve a balance of when to enter and exit a market and when not to trade at all by using this method. He used many factors pertaining to nature and the seasons in considering market timing. In his time (the 18th century), the regional rice markets in Japan could be disastrously affected by adverse weather conditions and many other natural phenomena.
 Conclusion 結論 - Ketsuron
These principles of candlestick charting are some of the most important in the technique. These examples demonstrate how Sakata's five methods can be applied to current-day trading. A group of patterns created more than two centuries ago can still be used to predict possible trend movements and reversals in the present day.
But the trader who wishes to try out candlesticks should be forewarned. There is more to the candlestick technique than simply Sakata's five methods. Understanding only a portion of anything can be dangerous, and the candlestick technique is no exception. Sokyu Honma gained his wealth by knowing when to get in and out of a market, and when not to trade at all.
Read more by Gary Wagner


