Support and resistance levels on bar charts are a major component in the study of technical analysis. Many traders, including myself, use support and resistance levels to identify entry and exit points when trading markets. When determining support and resistance levels on charts, one should not overlook the key Fibonacci percentage "retracement" levels. I will detail specific Fibonacci percentages in this feature, but first I think it's important to examine how those numbers were derived, and by whom.
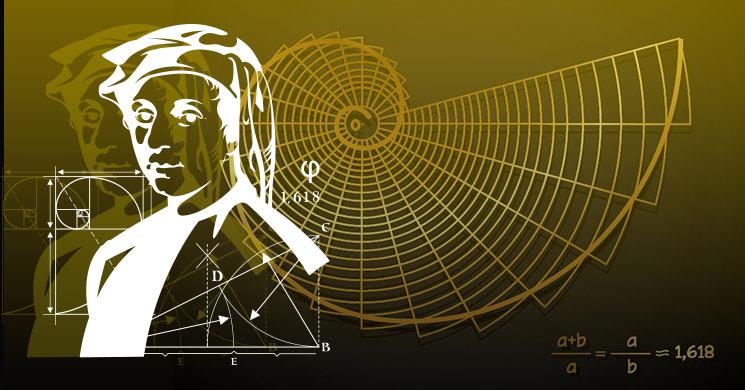
Leonardo Fibonacci da Pisa was a famous 13th century mathematician. He helped introduce European countries to the decimal system, including the positioning of zero as the first digit in the number scale. Fibonacci also discovered a number sequence called "the Fibonacci sequence." That sequence is as follows: 1,1,2,3,5,8,13,21,34 and so on to infinity. Adding the two previous numbers in the sequence comes up with the next number.
Importantly, after the first several numbers in the Fibonacci sequence, the ratio of any number to the next higher number is approximately .618, and the next lower number is 1.618. These two figures (.618 and 1.618) are known as the Golden Ratio or Golden Mean. Its proportions are pleasing to the human eyes and ears. It appears throughout biology, art, music and architecture. Here are just a few examples of shapes that are based on the Golden Ratio: playing cards, sunflowers, snail shells, the galaxies of outer space, hurricanes and even DNA molecules.
William Hoffer, in the Smithsonian Magazine, wrote in 1975: "The continual occurrence of Fibonacci numbers and the Golden Spiral in nature explain precisely why the proportion of .618034 to 1 is so pleasing in art. Man can see the image of life in art that is based on the Golden Mean."
I could provide more details about the Fibonacci sequence and the Golden Ratio and Golden Spiral, but space and time here will not permit. However, I do suggest you read the book "Elliott Wave Principle" by Frost and Prechter, published by John Wiley & Sons. Indeed, much of the basis of the Elliott Wave Principle is based upon Fibonacci numbers and the Golden Ratio.
Two Fibonacci technical percentage retracement levels that are important in market analysis are 38.2% and 61.8%. Most market technicians will track a "retracement" of a price uptrend from its beginning to its most recent peak. Other important retracement percentages include 75%, 50% (50% is also a Fibonacci number), and 66%. For example, if a price trend starts at zero, peaks at 100, and then declines to 50, it would be a 50% retracement. The same levels can be applied to a market that is in a downtrend and then experiences an upside "correction."

Many followers of Fibonacci retracement levels will look at the 38.2% and 50% retracement levels of a trending price move. A move in market price beyond a 38.2% retracement of a trending price move would begin to suggest that trending price move has ended. A move in market price beyond the 50% retracement of the trending price move would be a stronger signal the existing trending price move has ended, and that a trending price move in the opposite direction is likely underway.

The element I find most fascinating about Fibonacci numbers, the Golden Ratio and the Elliott Wave principle, as they are applied to technical analysis of markets--and the reason I am sharing this information with you--is that these principles are a reflection of human nature and human behavior.
The longer I am in this business and the more I study the behavior of markets, the more I realize human behavior patterns and market price movement patterns are deeply intertwined.
Read more by Jim Wyckoff