
A comparison of the Japanese Candlestick to an OHLC Bar Chart - by Gary S. Wagner
 This series of articles will cover the benefits of Japanese candlestick charts. While it is drawn slightly different than a traditional bar chart, it contains visual information and an emphasis on the price action between the open and close of a trading session.
 This section will compare the differences between a bar and candle chart. Then we will explain different types of single candles. The next section will explore and explain the patterns that form from multiple candles. Part four will look at the Sakata Five, the backbone of candlestick patterns. We will introduce indicators that work well with western and eastern candlestick charts.
One of the most common forms of Western financial charts that is still used to this day on most financial news networks is known as a line chart. This chart typically plots the closing price of a stock or commodity and then draws a line connecting each closing price for the day.
While the information is valid and offers insight, it does information than either the candlestick chart or an OHLC (bar) chart.
Rather than just plotting the closing price, a bar chart uses four data points consisting of the open, high, low and close instead of just the close.
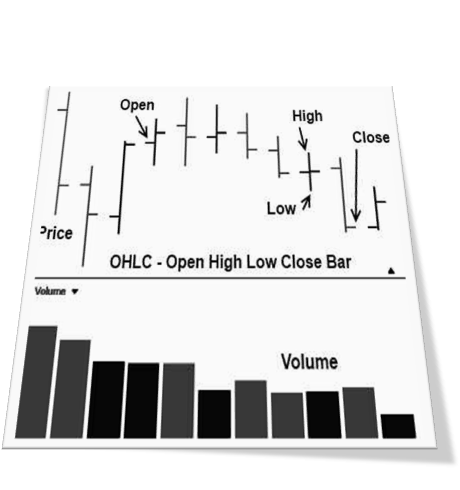
The necessary information to create a bar or candlestick chart are identical. However, even though there are only a few distinctions between how these charts are drawn, it is the interpretation of the data used for the identification of market sentiment.
By viewing data through the eyes of a candlestick chart what is revealed is the entire battle that took place during that trading session.
What is revealed in a candlestick pattern is unique, and unavailable for the most part to the Western technician. There are exceptions with parallel patterns such as a head and shoulders formation, and a three-mountain top. The candlestick pattern called tower bottoms, and the Western counterpart the double bottom. There are also many additional patterns in candlestick analysis that this technique can be used in combination to, rather than, Western pattern recognition.
One of the primary differences is that the candlestick chart uncovers the way a Japanese technical analyst views the data. Just as an Alaskan Inuit has 27 words for snow, the Japanese technicians have an abundance of word pictures (Candlestick patterns) to identify different types of market sentiment.
 From this expanded perception that grants the Japanese technician to forecast projections unseen through an OHLC bar chat. It defines what the primary focus and the mind-set behind the thought process which is quite different when compared to the Western technician. Although the difference is subtle, the additional insight is profound.
The depth of information and the simplicity of the components make candlestick charts a favorite among traders. The ability to chain together many candlesticks to reveal an underlying pattern makes it a compelling tool when interpreting price action history and forecasts.
Understanding the difference of the linguistic mindset of a Japanese technician versus a Western technician is the key to why candlesticks and candlestick patterns offer a unique insight. They can reveal a component of charts completely unseen to the Western technician.
The following example will illustrate the differences in the thought process of an Eastern versus Western technical analyst is the way they describe the chart which in turn defines the way they think and interpret the data.
 To the Western technician one of the most important pieces of information is the relationship of the prior closing price to current closing price. When one says that gold moved up 3 ½ dollars, we intrinsically understand that this is a reference to the net price change between the close of the two sessions. All the emphasis is placed on the change between the prior and current closing prices.
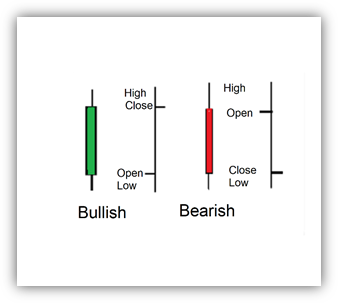
The Eastern market technician has a completely different mindset and linguistic focus. The most important information to an Eastern market technician is not comparing closing prices, rather it is the relationship between where the market opens and where the market closes during a trading session.
The candle created from that price action will be displayed as a picture or visual representation of the financial battle that took place. It also visually displays the outcome of that trading session.
Different candlesticks will depict different market results. A large candle that closes above the open is an extremely strong candle indicating the bullish faction had absolute domination during the entire session from open to close; they dominated price action and succeeded in winning the battle.
When these individual candlesticks are combined together in particular combinations, they form patterns which can forecast future price moves. These include patterns predicting key reversal or pivot points, continuation of a trend, exhaustion and consolidation patterns.
Read more by Gary Wagner


