
I have been involved in the science of technical analysis and market forecasting since 1985. During my formative years, I was classically trained in the art of Western technical analysis.
In the late 1980’s I was working at a financial news station in Southern California. John Bollinger was the technical analyst and manager. This was my first real exposure to the process a market technician uses as he gleaned information from the data. I had a rare glimpse of the process by which an analyst creates a trading model.
In early nineties, Japanese candlestick charts became known and available to Western traders. However, knowing how to identify and interpret the candlestick patterns found within the chart was another thing all together. It simply was not common knowledge to the western trader.
It was then when I was first exposed to Japanese candlestick charts patterns. It occurred by chance, when I noticed one of my client’s trading style change dramatically. It looked and felt counter-intuitive and had an extremely radical approach. That being said, the technique was returning consistent profits.
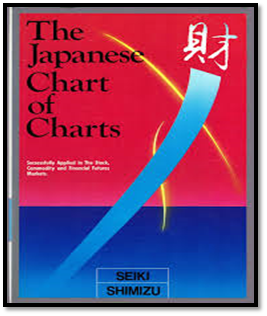
He was an engineer for General Electric, and not a professional trader. But whatever system he was using it had the most precise and accurate market timing I had ever seen. He would sell into rallies, and buy into corrections, just before a trend reversal occurred and nine out of ten times, he got it right. When I asked him what system enabled him to have such consistency, he said it was too hard to explain, but he would send me a copy of the book that taught him the method. I was ecstatic, about a week later I received a copy of “The Japanese chart of charts”. This was the first book written in Japanese by a famous market technician. It was released in the United States in 1988.
The Japanese chart of charts” written by Seki Shmizui was the most complex book on the subject translated into english to date. It took me more than a single read before the concepts he presented began to make complete sense.
Since then 30 years later, I re-read his book at least every other year. I do this because of how it allowed me to "see" with greater understanding that was quite different then a Western technician view. Each time I re-read this book, I learn something new, something that had alluded me during prior reads.
In 1991 Brad Mathey and myself co-created the first software application to identify Japanese candlestick patterns, “The Candlestick Forecaster”.
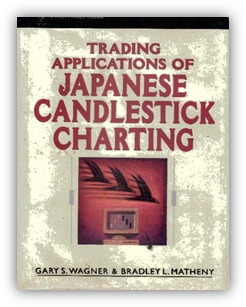
In 1994 we also co-authored our first book titled “Trading Applications of Japanese Candlestick Charting”. The book was published by John Wiley & Sons, New York.
After many years of studying Japanese technical analysis including candlestick charts and their patterns, Heiken Ashi and three-line break charts I found the information contained in this technique was not only superlative, but more importantly, it offered insight unavailable through the eyes of the Western technician.
After creating the software application and writing a book on Japanese candlestick charting, I was invited to speak at many financial seminars. The pinnacle symposium to be invited to, and participate in, was the annual Dow Jones Financial Symposium sponsored by Dow Jones & Company, Inc. The Symposium took over three months to complete, but most speakers, including myself, took a single one-month leg.
My one-month participation began in London, visiting eight more countries and speaking at a total of nine venues, the last one in Luxemburg. We were allotted a travel day to and another day from each new venue and country. We also got a minimum of one rest day before an event, which meant that the speakers got to spend a lot of time with each other. It was like being a part of a traders Rat -Pac.
I was blessed to be fortunate enough to have some of the most prolific and cutting-edge market technicians, the best financial analysts of my time, take me under their wing, and in some cases mentor me. This was an incredible time, one of the most influential periods of discovery. Insights lead to questions that created a pathway to acquire the knowledge needed to learn the principles required to learn the process. The process by which market technicians create and test trading models. Without understanding the process; the market technician’s studies have no meaning, and the science would not be possible.
I spent a full month with great technical minds such as Tim Slater, the founder of Computrac. Jake Bernstein, one of original “turtles” for Richard Denison. Tom Demark, founder and CEO of DeMark Analytics, LLC, creator of the DeMark Indicators. Tom Dorsey, a well-known expert of point and figure charting and Larry Williams, the author of 11 books, most on stocks and commodity trading.
During this period, I was able to learn from some of the best analytical minds, many of the creators of their own technical studies. Studies that are now considered standards, taught in introductory classes on technical trading models. Studies such as Bollinger bands, the Williams %R, the DeMark Indicators, and more. The knowledge I gained through my associations with these major players allowed me to learn, incorporate and apply this knowledge and blend it with my studies of the Japanese technician.
The series of articles you are about to read contains a brief but thorough overview of Japanese technical theory beginning with the historical perspective as well as the classic underlining theory behind this technique. They use word pictures, kanji so to speak, to interpret price movement over time. These are called candlestick patterns and the Sakata Five. Both Eastern and Western technicians have methods that produce valuable insight and merit, however when both are combined, there is a synergistic effect were the gained wisdom is greater than the sum of its parts, i.e., using only Western and Eastern technical theories.
Our series will begin by reprinting the forward to my book. It was written by John Bollinger, creator of the Bollinger bands, and my first real mentor. We initially met when he was the Chief Market Analyst of a small Financial News Network in Southern California, that became part of the first financial news network, FNN. I would watch his reports done live in the studio. The more time I spent in the studio the more insight I gained about the process of technical analysis.
The reason I chose to begin this series on Japanese technical analysis with the forward written by Bollinger is because it is just as prolific today as it was when he wrote it in 1993. I believe it will give you an insight into why so many market technicians in the United States and Western Europe have incorporated Japanese techniques and theories.
Simply put you only add the information available to you for your market analysis, and the insight gained by incorporating these techniques will only make you a much better trader.
Read more by Gary Wagner


